
Domino V12 – SSL Performance revisited – Testing the curves
In my previous post I looked at the performance of the Domino V12 HTTP task in de-/encrypting SSL traffic. One of my biggest findings was the huge influence of the elliptic curves on the performance. An Nginx SSL offloader using older curves (ECDH P-384 384 bits in this case) was twice as slow as Domino V12 using the latest X25519 253 bits curve. As a result of this post, I was asked if I could run some more tests on Domino V12 using these other curves. As the test setup was there this is fairly simple to do. Here are the results of these tests. I also tested the most optimal setup for Domino 11 to compare it to Domino 12.
Test Setup
In my previous post, I explained my test setup. I’m using the Apache Benchmarking tool to send 25.000 requests straight to a Domino server that’s running in a Podman container on the same host that the benchmark tool runs on (so I exclude network dependencies). As a key I use the ECDSA NIST P-256 key that I created for my previous post on the new Certificate Manager, which is the highest performing key. For the curves tests with this key, I set notes.ini parameters which HCL has described here. Currently this page isn’t really clear, but from other notes.ini parameters it follows that the right parameter to put in your notes.ini is for example “SSL_DISABLE_CURVE_X25519=1” (in the current documentation the “=1” is omitted). Using these notes.ini parameters I will disable the faster curves in order and test the results.
Results
Using the notes.ini parameters, we can get 5 different curves for the ECDSA key. I ran 25.000 requests against all these curves several times. The results are not constant (there’s more running on this server than just Domino), but the results were always with 3 seconds of each other per curve. These are the results:
-
X25519
-
ECDH P-256
-
X448
-
ECDH P-384
-
ECDH P-521
Server Software:        Lotus-Domino

 Server Hostname:        url2.martdj.nl

 Server Port:            443

 SSL/TLS Protocol:       TLSv1.2,ECDHE-ECDSA-AES256-GCM-SHA384,256,256

 Server Temp Key:        X25519 253 bits

 TLS Server Name:        url2.martdj.nl

 Document Path:          /homepage.nsf

 Document Length:        4788 bytes

 Concurrency Level:      1000

 Time taken for tests:   29.985 seconds

 Complete requests:      25000

 Failed requests:        0

 Total transferred:      127600000 bytes

 HTML transferred:       119700000 bytes

 Requests per second:    833.76 [#/sec] (mean)

 Time per request:       1199.389 [ms] (mean)

 Time per request:       1.199 [ms] (mean, across all concurrent requests)

 Transfer rate:          4155.76 [Kbytes/sec] received

 Connection Times (ms)

               min  mean[+/-sd] median   max

 Connect:        2  401 153.3    376    1674

 Processing:   103  781 125.1    784    1502

 Waiting:        1  767 123.4    769    1500

 Total:        154 1182 195.3   1168    2611
Server Software:        Lotus-Domino

 Server Hostname:        url2.martdj.nl

 Server Port:            443

 SSL/TLS Protocol:       TLSv1.2,ECDHE-ECDSA-AES256-GCM-SHA384,256,256

 Server Temp Key:        ECDH P-256 256 bits

 TLS Server Name:        url2.martdj.nl

 Document Path:          /homepage.nsf

 Document Length:        4788 bytes

 Concurrency Level:      1000

 Time taken for tests:   30.489 seconds

 Complete requests:      25000

 Failed requests:        0

 Total transferred:      127600000 bytes

 HTML transferred:       119700000 bytes

 Requests per second:    819.96 [#/sec] (mean)

 Time per request:       1219.578 [ms] (mean)

 Time per request:       1.220 [ms] (mean, across all concurrent requests)

 Transfer rate:          4086.97 [Kbytes/sec] received

 Connection Times (ms)

               min  mean[+/-sd] median   max

 Connect:        2  403 119.5    388    1504

 Processing:   197  797 119.5    799    1410

 Waiting:        1  785 118.3    786    1410

 Total:        199 1200 167.6   1195    2536
Server Software:        Lotus-Domino

 Server Hostname:        url2.martdj.nl

 Server Port:            443

 SSL/TLS Protocol:       TLSv1.2,ECDHE-ECDSA-AES256-GCM-SHA384,256,256

 Server Temp Key:        X448 448 bits

 TLS Server Name:        url2.martdj.nl

 Document Path:          /homepage.nsf

 Document Length:        4788 bytes

 Concurrency Level:      1000

 Time taken for tests:   40.244 seconds

 Complete requests:      25000

 Failed requests:        0

 Total transferred:      127600000 bytes

 HTML transferred:       119700000 bytes

 Requests per second:    621.21 [#/sec] (mean)

 Time per request:       1609.763 [ms] (mean)

 Time per request:       1.610 [ms] (mean, across all concurrent requests)

 Transfer rate:          3096.34 [Kbytes/sec] received

 Connection Times (ms)

               min  mean[+/-sd] median   max

 Connect:        3  636 221.2    622    2110

 Processing:   272  954 212.7    969    1930

 Waiting:        1  568 203.4    574    1639

 Total:        276 1590 327.3   1536    3370
Server Software:        Lotus-Domino

 Server Hostname:        url2.martdj.nl

 Server Port:            443

 SSL/TLS Protocol:       TLSv1.2,ECDHE-ECDSA-AES256-GCM-SHA384,256,256

 Server Temp Key:        ECDH P-384 384 bits

 TLS Server Name:        url2.martdj.nl

 Document Path:          /homepage.nsf

 Document Length:        4788 bytes

 Concurrency Level:      1000

 Time taken for tests:   67.588 seconds

 Complete requests:      25000

 Failed requests:        0

 Total transferred:      127600000 bytes

 HTML transferred:       119700000 bytes

 Requests per second:    369.89 [#/sec] (mean)

 Time per request:       2703.530 [ms] (mean)

 Time per request:       2.704 [ms] (mean, across all concurrent requests)

 Transfer rate:          1843.65 [Kbytes/sec] received

 Connection Times (ms)

               min  mean[+/-sd] median   max

 Connect:        6 1246 490.5   1218    2872

 Processing:   169 1440 484.2   1460    3864

 Waiting:        1  881 464.6    828    2975

 Total:        344 2687 645.8   2585    4697
Server Software:        Lotus-Domino

 Server Hostname:        url2.martdj.nl

 Server Port:            443

 SSL/TLS Protocol:       TLSv1.2,ECDHE-ECDSA-AES256-GCM-SHA384,256,256

 Server Temp Key:        ECDH P-521 521 bits

 TLS Server Name:        url2.martdj.nl

 Document Path:          /homepage.nsf

 Document Length:        4788 bytes

 Concurrency Level:      1000

 Time taken for tests:   71.425 seconds

 Complete requests:      25000

 Failed requests:        0

 Total transferred:      127600000 bytes

 HTML transferred:       119700000 bytes

 Requests per second:    350.02 [#/sec] (mean)

 Time per request:       2857.006 [ms] (mean)

 Time per request:       2.857 [ms] (mean, across all concurrent requests)

 Transfer rate:          1744.61 [Kbytes/sec] received

 Connection Times (ms)

               min  mean[+/-sd] median   max

 Connect:        8 1076 265.1   1024    2667

 Processing:     3 1747 268.2   1752    3080

 Waiting:        1 1674 266.5   1673    2899

 Total:        154 2823 332.6   2811    4712
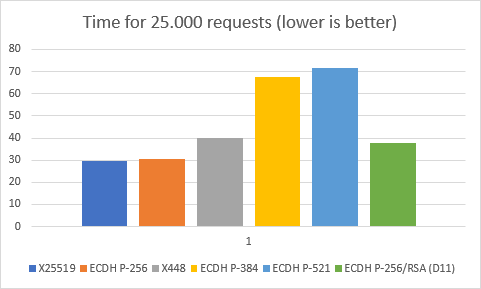
I started with the most optimal setting: X25519. With this curve we need between 27,5 and 30,5 seconds to complete 25.000 requests. We move on to the next curve.
This results in a ECDH P-256 curve I’ve run multiple tests with this curve and the results would vary between 30.4 seconds and 32 seconds. This makes this curve a bit slower than the X25519 curve, but really not much. Somewhere in the 2-8% range.
The next curve we see is the X448 448 bits curve and now the performance starts to seriously degrade. The performance of this curve is about 32-38% less than of our original X25519 curve. But we continue by adding the next notes.ini parameter.
Domino now uses an ECDH P-384 384 bits curve and the performance impact starts to become massive. Performance dropped by a staggering 125-130% compared to the original X25519 curve! Also interesting to note is that we’re now at the same curve that my Nginx server originally used. When using this curve, Nginx as an SSL offloader, using the same curve, is about 5-10% faster than going straight to Domino. We’re not done yet though.
By adding the next notes.ini parameter we get a ECDH P-521 curve. This curve gives another performance drop, but compared to the drop between the previous curve and the curve before that, we now see a relatively minor drop. We’re now at a 137-140% performance drop compared to the original X25519 curve. There’s one notes.ini parameter left. However, as you might have expected, adding this one means that there simply isn’t any curve left to use with an ECDSA key, so Domino will no longer be able to encrypt/decrypt SSL traffic.
CPU Load
As I did in the previous post, I also measured the cpu load during the runs with the different curves. I added the percentages of user and system space together and put them all in one graph:
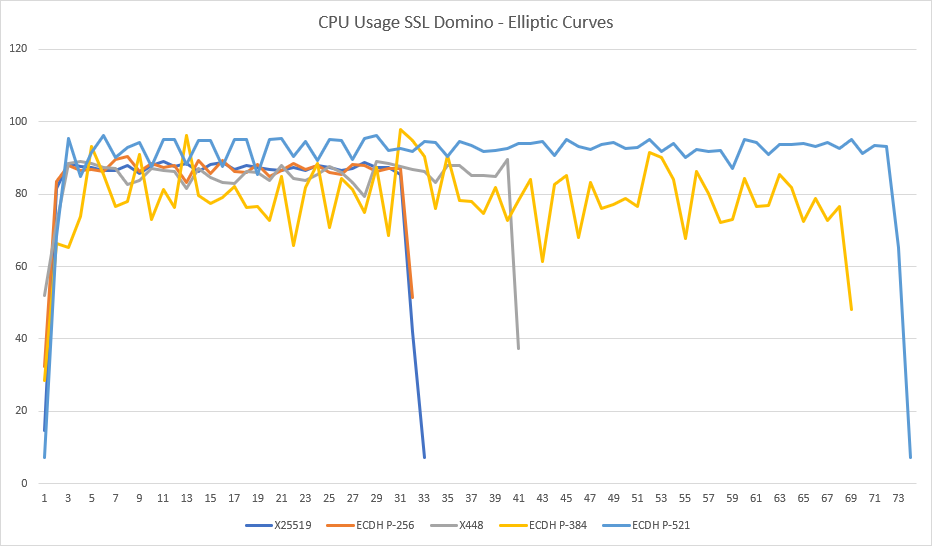
As you can see the cpu load of the X25519, ECDH P-256 and X448 curves is quite similar, though X448 takes longer, so in total takes more cpu cycles. The CPU Load of ECDH P-384 is on average a bit lower (though very spiky), but takes way longer as is thus less efficient. The load of ECDH P-521 curve is the highest and this the longest, so this is the least efficient curve.
There’s another aspect to take into consideration here though. Normally there’s a difference in load with these curves between the server and the client where some curves use more cpu cycles on the server, but less on the client and vice versa. In these measurements, I measured the load of the server and client together. I can therefore say that X25519 is the most efficient curve altogether, but I can’t say what the exact impact is on the server and client individually. There’s one interesting thing I noticed though. Look at these charts with the cpu load for the X25519 and ECDH P-384 curves.
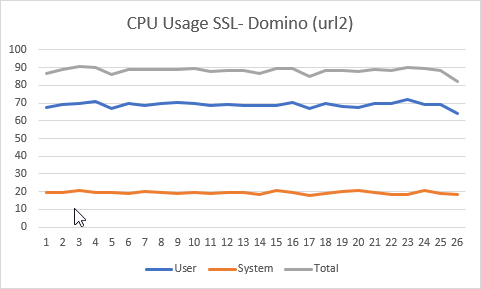
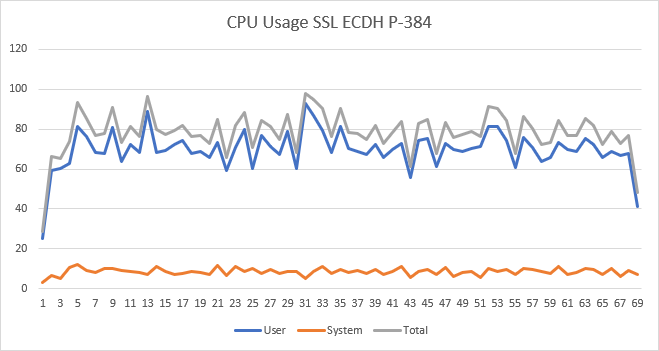
The top graph is from my previous blog post with the details for the X25519 curve, the second graph is for the ECDH P-384 curve. Notice that the cpu load in system space is a lot lower with the 2nd curve. I’m afraid I don’t know enough about which processes run in user space and which processes in system space to give any meaning to this outcome, but maybe someone else can.
Results for Domino 11
So you might wonder, what about Domino 11? I replaced my Docker instance for a different server running Domino 11.0.1 FP2 to test this. So the test setup is identical in all other ways. Domino 11 doesn’t support an ECDSA key and of course it doesn’t have the Certificate Manager, so I had to create a keyring file based on the RSA certificate I had for my nginx server. The results for Domino 11.0.1 FP2 were:
Server Software:        Lotus-Domino
 Server Hostname:        url3.martdj.nl
 Server Port:            443
 SSL/TLS Protocol:       TLSv1.2,ECDHE-RSA-AES256-GCM-SHA384,2048,256
 Server Temp Key:        ECDH P-256 256 bits
 TLS Server Name:        url3.martdj.nl
 Document Path:          /homepage.nsf
 Document Length:        4788 bytes
 Concurrency Level:      1000
 Time taken for tests:   37.773 seconds
 Complete requests:      25000
 Failed requests:        0
 Total transferred:      127600000 bytes
 HTML transferred:       119700000 bytes
 Requests per second:    661.85[#/sec] (mean)
 Time per request:       1510.924 [ms] (mean)
 Time per request:       1.511 [ms] (mean, across all concurrent requests)
 Transfer rate:          3298.89 [Kbytes/sec] received
 Connection Times (ms)
               min  mean[+/-sd] median   max
 Connect:        3  482 132.4    466    1705
 Processing:     2 1006 110.0   1013    1556
 Waiting:        1  987 109.1    993    1533
 Total:        114 1488 172.2   1481    2778
Though we’re still talking about a performance degradation of 25%, I must admit this was by far not as bad as I had expected.
Conclusion
From my tests between Domino and Nginx where the latter would act as SSL offloader, I already knew that performance of SSL encryption/decryption is highly dependent of which elliptic curve is used in the transaction. This finding was confirmed in these tests. Using suboptimal curves could degrade your SSL performance by a whopping 140%. You have to do quite some effort to get such bad performance though. More interesting is maybe the difference between the best performance of Domino 11.0.1 FP2 vs the best performance of Domino 12.0 beta 2. It turned out that by creating an ECDSA key and using the X25519 curve, Domino 12 performs ±25% better than Domino 11.0.1 FP2. That’s a nice bonus on top of all the other benefits of the new Certificate Manager.